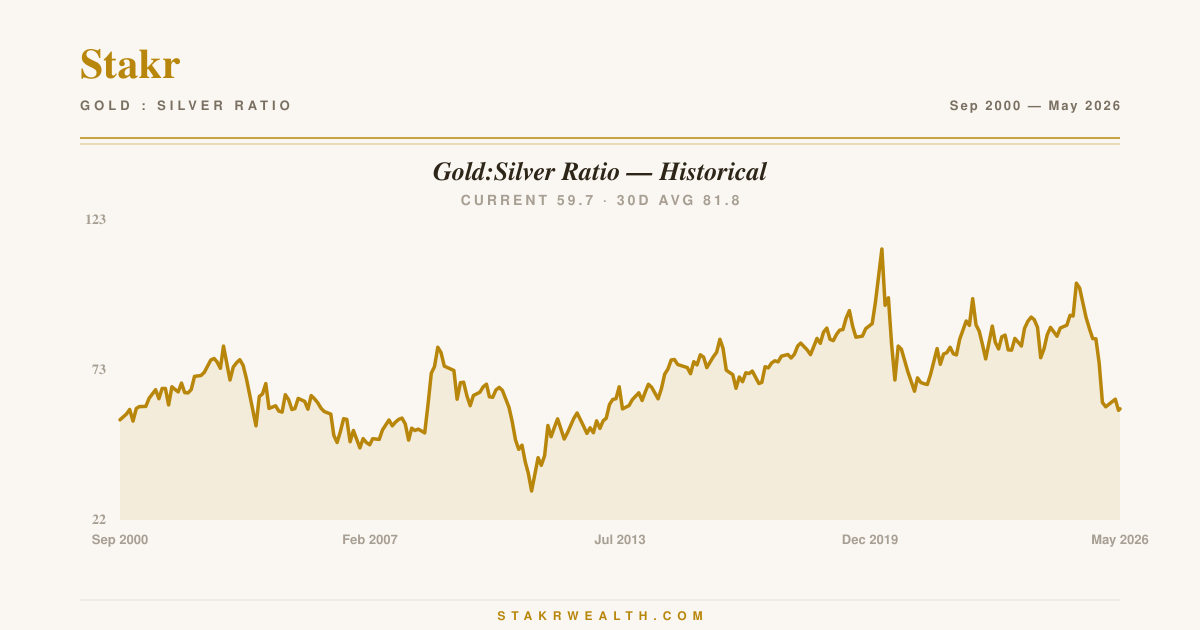
Gold-to-silver ratio — live + historical
The classic precious-metals signal, charted with 265 months of data. Current ratio 68.3.
What is the gold-to-silver ratio?
The gold-to-silver ratio is simply the number of ounces of silver it takes to buy one ounce of gold. A ratio of 80 means silver is "80x cheaper" than gold by weight. For stackers, it's a quick signal of relative value between the two metals.
How stackers use it
Many precious-metals investors use the ratio as a rotation guide: when the ratio runs high (silver is "cheap"), they tilt purchases toward silver; when the ratio is low (silver is "expensive"), they tilt toward gold. Over the period shown (Sep 2000 — Jun 2026) the ratio averaged 69.2 with a range of 32.0–113.0.
Historical context
For most of the 19th and 20th centuries, the ratio sat between 15 and 50. Since the end of the gold standard, the ratio has averaged closer to 69.2, with notable spikes during financial crises. Today it sits at 68.3 — below its recent 30-day average of 81.8.
Calculate your own gold:silver position
Track your gold and silver holdings in one place, see your live gold:silver ratio, and set alerts when it crosses your target. Start tracking — it's free.
Track your own stack — free
Stakr is a free portfolio tracker for gold and silver investors. Log your coins, set price alerts, and compare your stack to gold or the market.
Start tracking — it's free